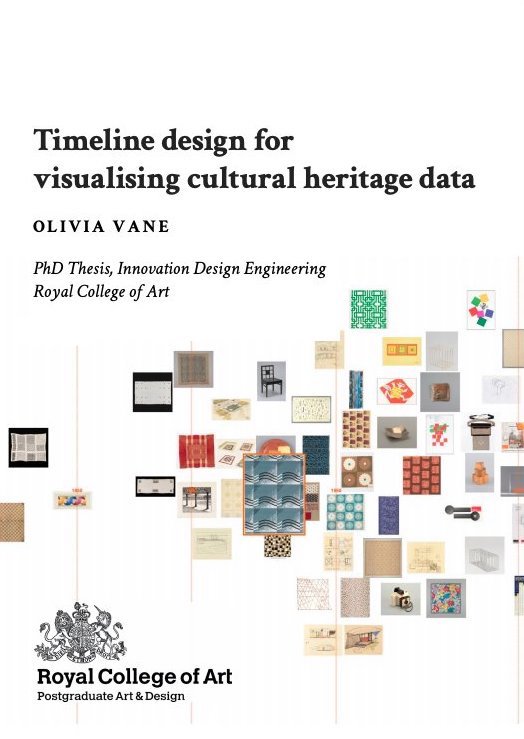
Timeline design for visualising cultural heritage data
PhD thesis.
Royal College of Art, Department of Innovation Design Engineering
2019
Read: PDF
Cite: Vane, O. 2019. Timeline design for visualising cultural heritage data. PhD thesis, Royal College of Art.
Supervised by Professor Stephen Boyd Davis
Funded by an AHRC scholarship via the London Doctoral Centre for Design.
Abstract
This thesis is concerned with the design of data visualisations of digitised museum, archive and library collections, in timelines. As cultural institutions digitise their collections—converting texts, objects, and artworks to electronic records—the volume of cultural data available grows. There is a growing perception, though, that we need to get more out of this data. Merely digitising does not automatically make collections accessible, discoverable and comprehensible, and standard interfaces do not necessarily support the types of interactions users wish to make.
Data visualisations—this thesis focuses on interactive visual representations of data created with software—allow us to see an overview of, observe patterns in, and showcase the richness of, digitised collections. Visualisation can support analysis, exploration and presentation of collections for different audiences: research, collection administration, and the general public. The focus here is on visualising cultural data by time: a fundamental dimension for making sense of historical data, but also one with unique strangeness.
Through cataloguing, cultural institutions define the meaning and value of items in their collections and the structure within which to make sense of them. By visualising threads in cataloguing data through time, can historical narratives be made visible? And is the data alone enough to tell the stories that people wish to tell?
The intended audience for this research is cultural heritage institutions. This work sits at the crossroads between design, cultural heritage (particularly museology), and computing—drawing on the fields of digital humanities, information visualisation and human computer-interaction which also live in these overlapping spaces.
This PhD adds clarity around the question of what cultural visualisation is (and can be) for, and highlights issues in the visualisation of qualitative or nominal data. The first chapter lays out the background, characterising cultural data and its visualisation. Chapter two walks through examples of existing cultural timeline visualisations, from the most handcrafted displays to automated approaches. At this point, the research agenda and methodology are set out. The next five chapters document a portfolio of visualisation projects, designing and building novel prototype timeline visualisations with data from the Wellcome Library and Victoria & Albert Museum, London, Cooper Hewitt Smithsonian Design Museum, New York City, and the Nordic Museum, Stockholm. In the process, a range of issues are identified for further discussion. The final chapters reflect on these projects, arguing that automated timeline visualisation can be a productive way to explore and present historical narratives in collection data, but a range of factors govern what is possible and useful. Trust in cultural data visualisation is also discussed. This research argues that visualising cultural data can add value to the data both for users and for data-holding institutions. However, that value is likely to be best achieved by customising a visualisation design to the dataset, audience and use case.
Keywords
Cultural heritage data; historical data; cultural analytics; cultural informatics; humanities visualisation; generous interfaces; digital humanities; design; information design; interface design; data visualisation; information visualisation; time; timeline; history; historiography; museums; museology; archives; chronographics.