Olivia Vane
Toggle navigation
Projects
Writing
Speaking
PhD
About
Using JavaScript to make interactive data graphics
Off the Charts: The Economist's data journalism newsletter
2022
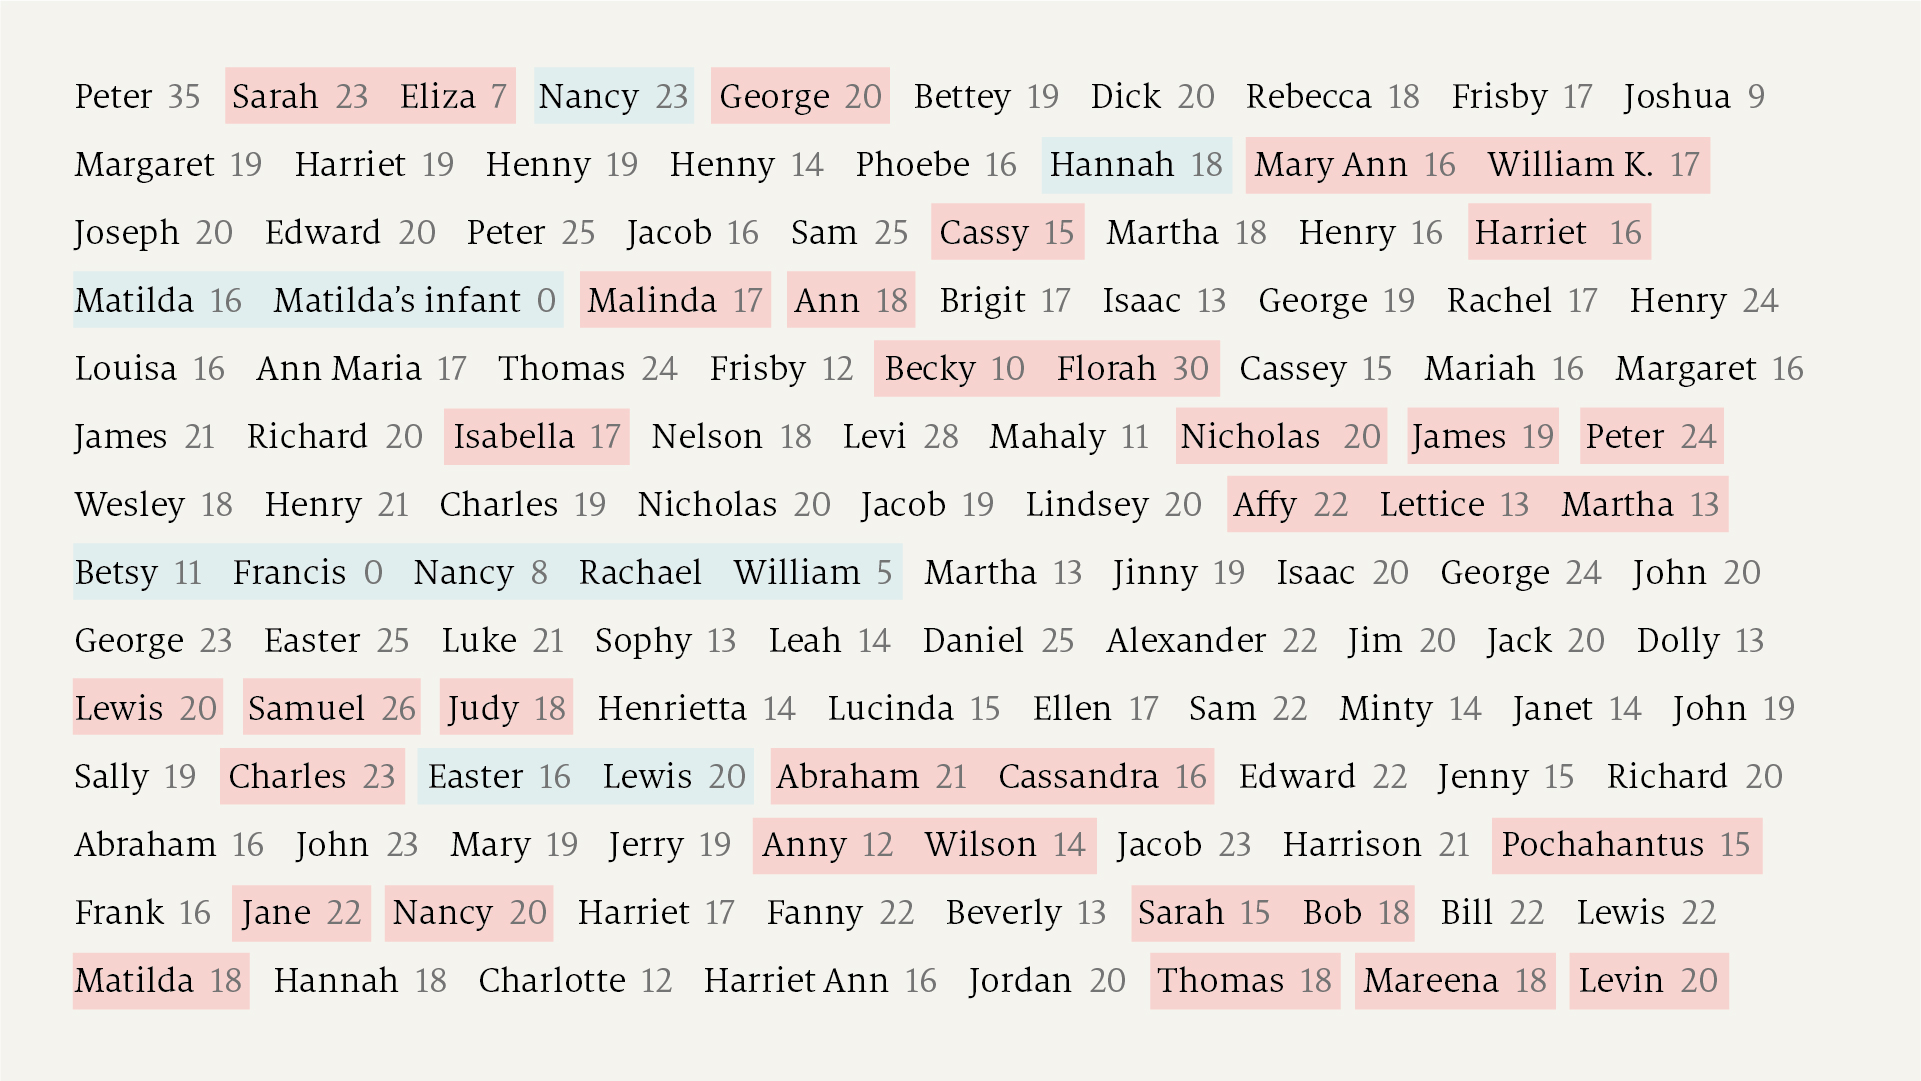
How to visualise sensitive topics
Off the Charts: The Economist's data journalism newsletter
2022
Tutorials: Scott Murray’s ‘Introduction to D3’, updated to D3 v7
2022
How we designed our Spotify interactive
Off the Charts: The Economist's data journalism newsletter
2022
Macromap: Interactive Maps in Time
Living with Machines blog
2021
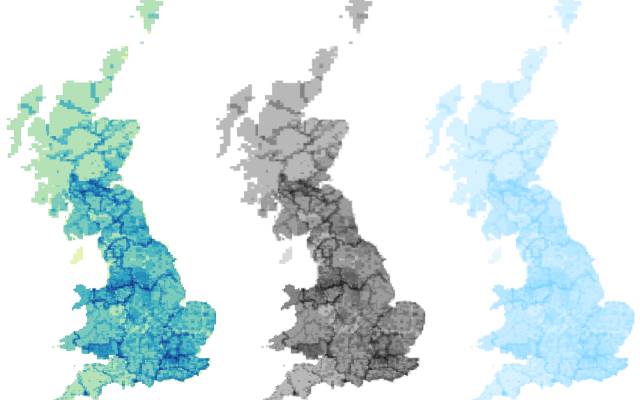
Heatmap for polygons: visualise overlaps in a large polygon dataset
Living with Machines blog
2020
Post-Covid Curation
The Cambridge Humanities Review, Autumn 2020, Issue 16.
2020
Press Picker: visualising formats and title name changes in the British Library’s newspaper holdings
Living with Machines blog
2020
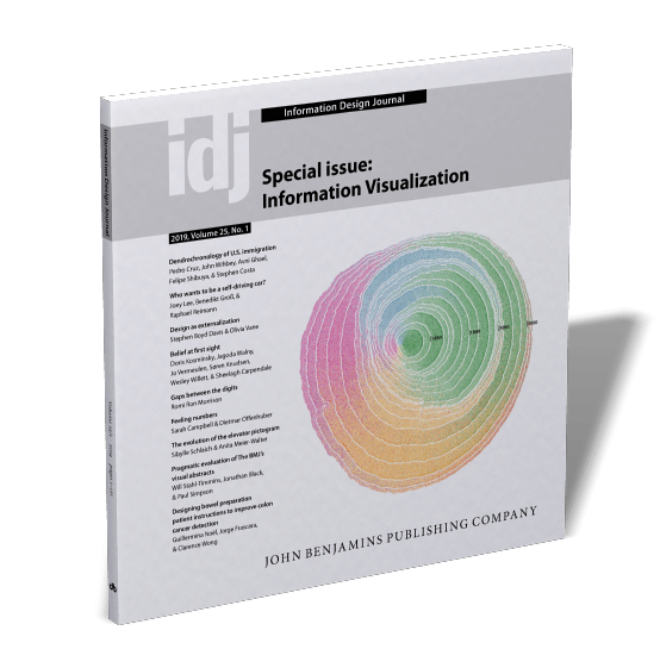
Design as externalization: Enabling research
Boyd Davis, S. and Vane, O. Information Design Journal 25(1), pp.28-42.
2020
D3 JavaScript visualisation in a Python Jupyter notebook
Living with Machines blog
2020
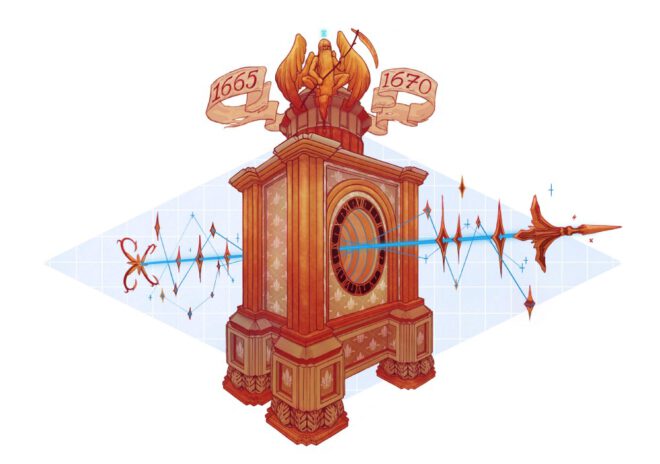
Strange Times: Visualising the Oddities of Time Data
Nightingale: The Journal of the Data Visualization Society
2020
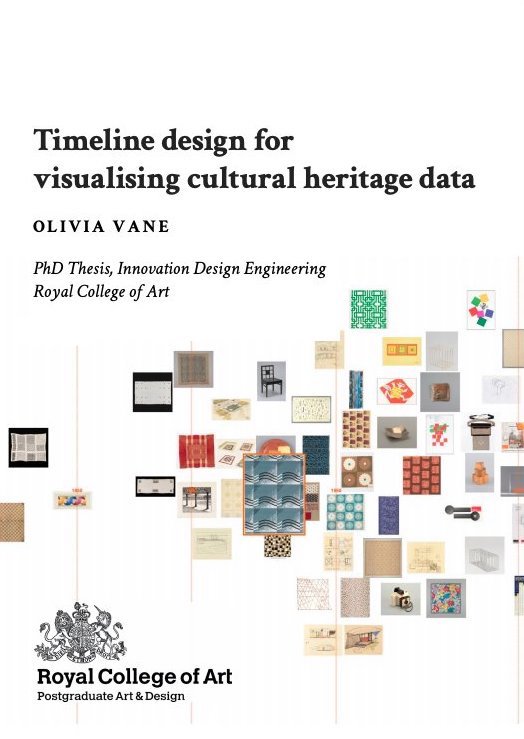
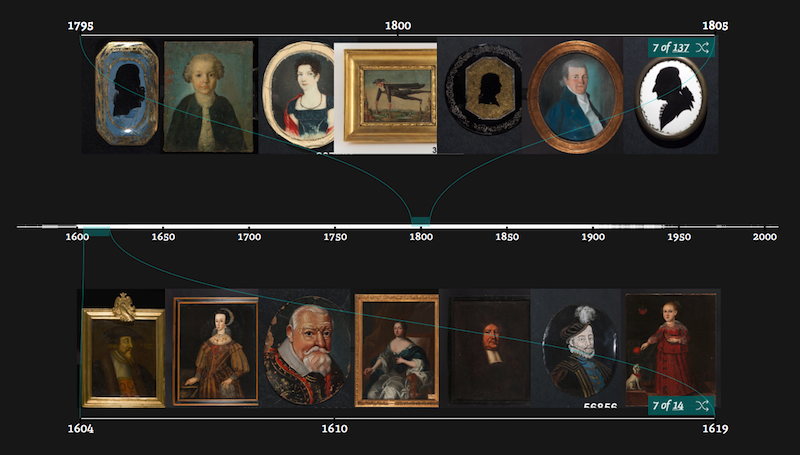
Timeline Design For Visualising Cultural Heritage Data
PhD Thesis, Royal College of Art
2019
Cultural Visualisation and the Value of Simplicity
EuropeanaTech Insight
2019
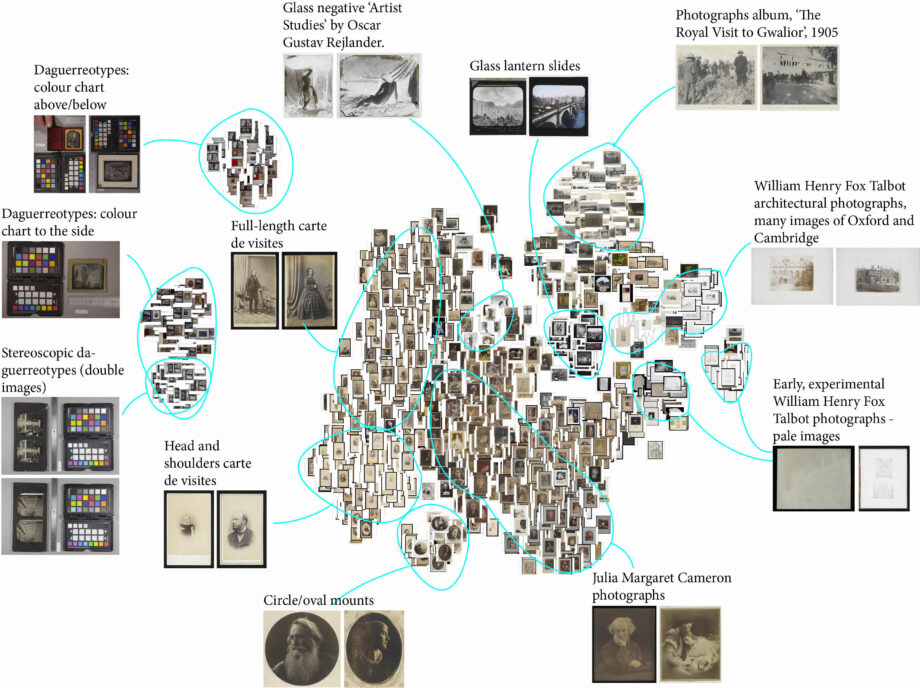
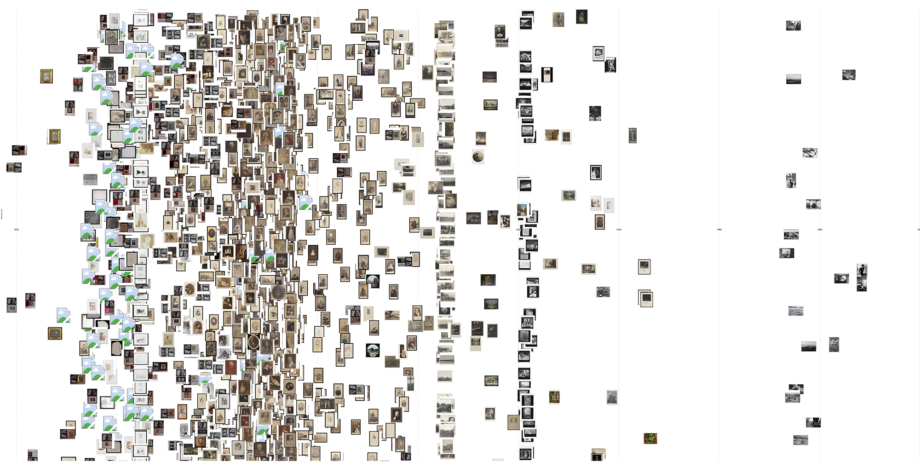
Visualising the Royal Photographic Society collection: Part 2
V&A Museum blog
2018
Visualising the Royal Photographic Society collection
V&A Museum blog
2018
Text Visualisation Tool for Exploring Digitised Historical Documents
Vane, O. ACM SIGCHI Conference on Designing Interactive Systems (DIS 2018). Hong Kong
2018
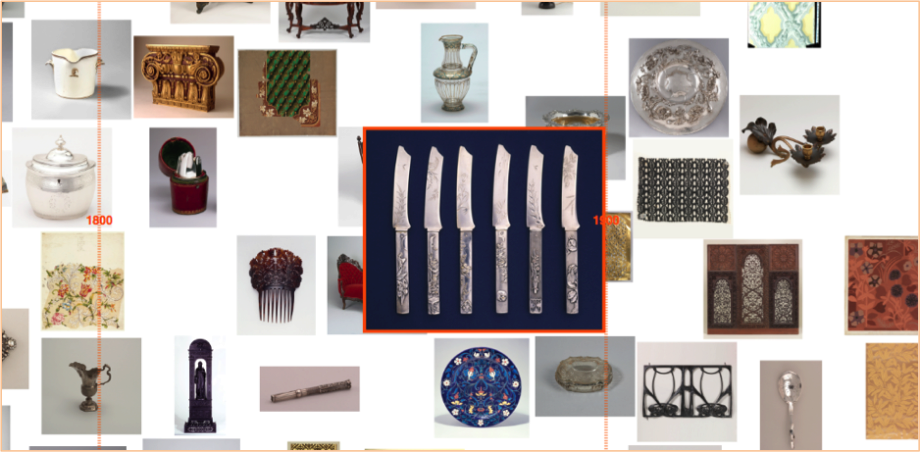
Exploring the Cooper Hewitt collection with timelines and tags
Cooper Hewitt Labs blog
2017
Data Visualisation to tell Stories about Collections
Davis, S.B., Vane, O. and Kräutli, F. Electronic Visualisation and the Arts Conference (EVA 2016) British Computer Society, London, UK. *Best Paper Award*
2016