Visualising the Royal Photographic Society collection
Historical photography at the V&A Museum
Visualising the Royal Photographic Society collection
Created with the Digital Media team at the Victoria & Albert Museum
Data and code
Visual similarity measures for photograph images generated using a pre-trained VGG16 neural network in Python using Keras. Visualisations built in JavaScript and D3.js
V&A collection data for the Royal Photographic Society collection
Read more
V&A blog posts: Visualising the Royal Photographic Society collection and Visualising the Royal Photographic Society collection: Part 2
Timeline design for visualising cultural heritage data, PhD Thesis, Chapter 7.
What patterns are revealed visualising a dataset of historical photography? How can algorithms help us explore photography conventions in the past?
This project used the Royal Photographic Society collection at the Victoria & Albert Museum, which showcases the history of the art of photography. The collection, over 270,000 photographs, was in the process of the being digitised and catalogued as these visualisations were created.
First, I visualised the data using categories from the museum catalogue, for example by 'photographic technique'. Next, I organised the photograph collection by the visual similarity between the images, using an AI algorithm (a pre-trained VGG16 neural network). This second approach reveals the visual landscape of the photographs. The algorithm positions similar images near each other, purely based on the image with no further information. Organising the photographs by visual similarity shows that the computer model picks up on some conventions for staging portraits over this period.
To read about the the development of these visualisations, what they show, and the lessons learnt in this project, I wrote two posts on the V&A blog: Visualising the Royal Photographic Society collection and Visualising the Royal Photographic Society collection: Part 2. My thesis chapter Exploratory visualisation: Royal Photographic Society collection builds on these.
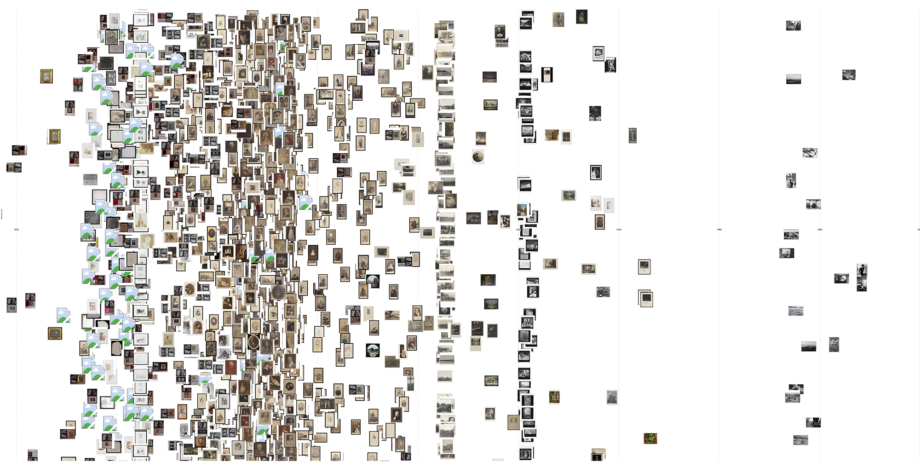
RPS data plotted horizontally by date, and at a random vertical position
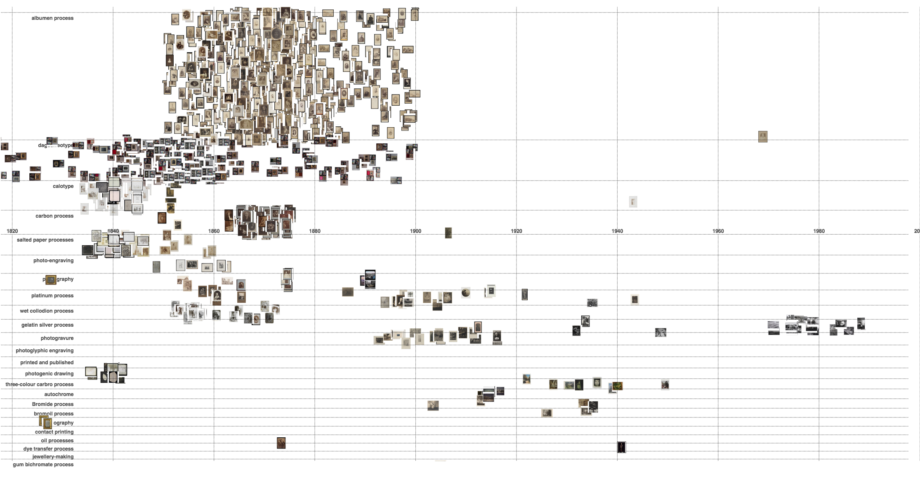
RPS data plotted horizontally by date, and vertically by photographic technique (techniques ordered from most to least items)
RPS data plotted horizontally by date, and vertically by photographic technique (techniques ordered from most to least items)
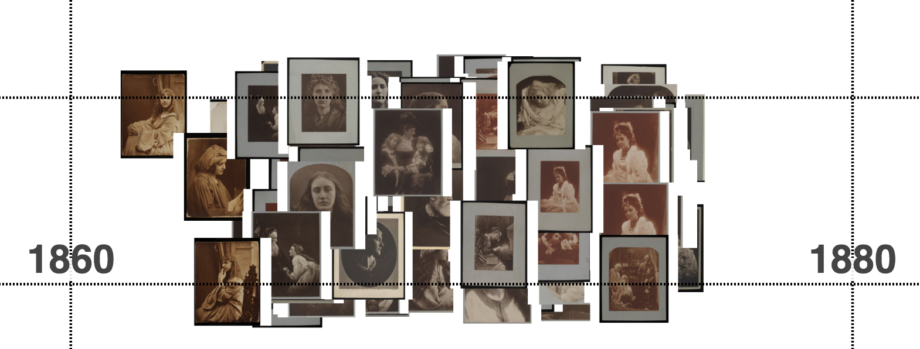
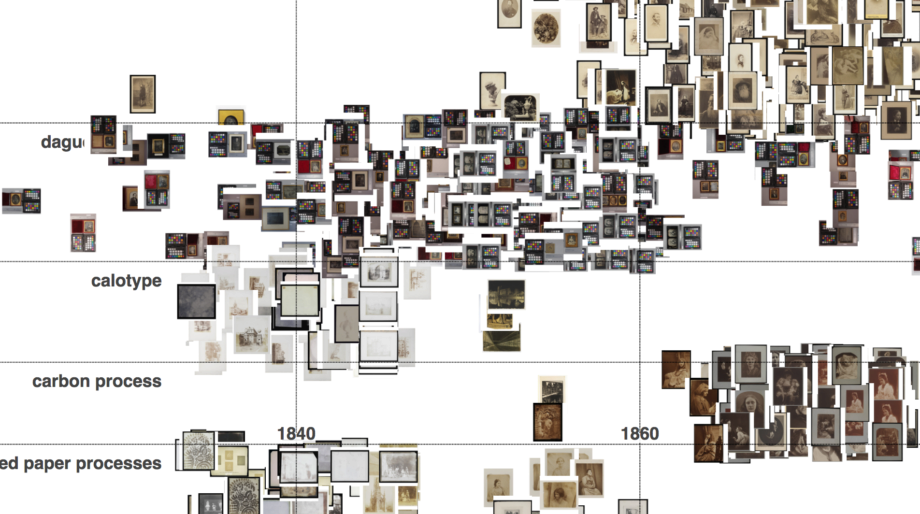
RPS data plotted horizontally by date, and vertically by photographic technique: detail showing carbon process Julia Margaret Cameron prints
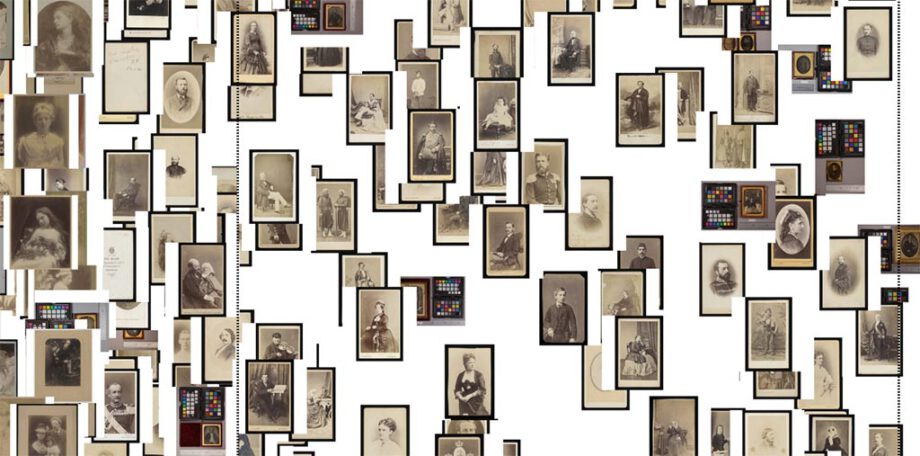
Detail from RPS data visualised by date and technique: lots of carte de visites
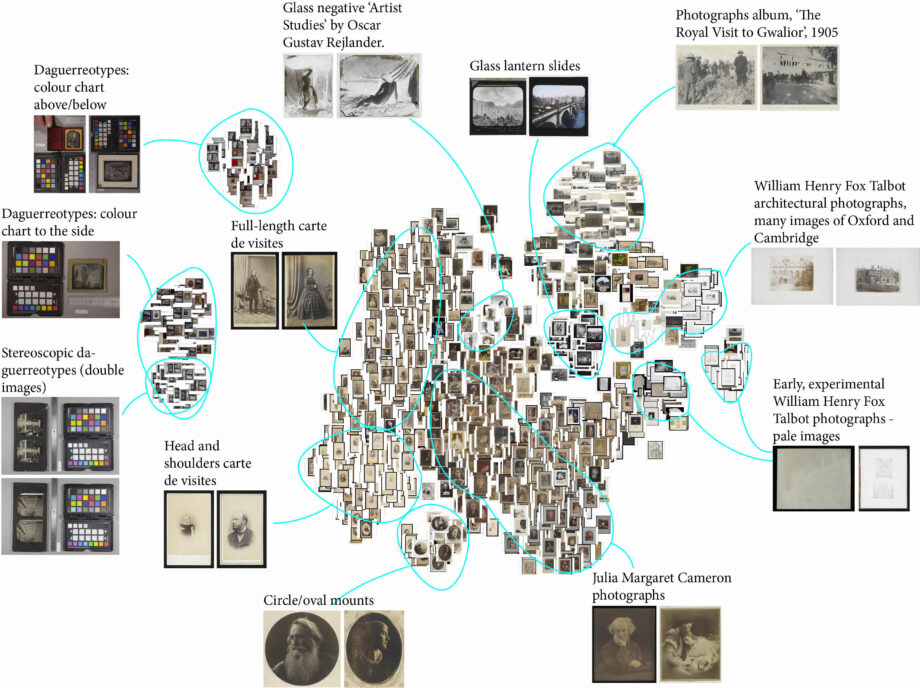
Annotated ‘t-sne’ plot of the RPS data