Waterfall
WWI portraits from the Imperial War Museum, London
Dataset
The Bond of Sacrifice collection of First World War portraiture at the Imperial War Museum, London.
Code
Built in JavaScript and D3.js
A waterfall visualisation of data from the Imperial War Museum (IWM), London. Soldiers’ portraits cascade down on a timeline, falling at the date of their death during World War I.
"The so-called Bond of Sacrifice collection contains more than 16,000 biographies and portraits of [British, Australian and Canadian] men [of all ranks] who served in the First World War."
[The bulk of the portraits are of military personnel. However the Royal Navy, Royal Marines and Royal Flying Corps are also represented.]
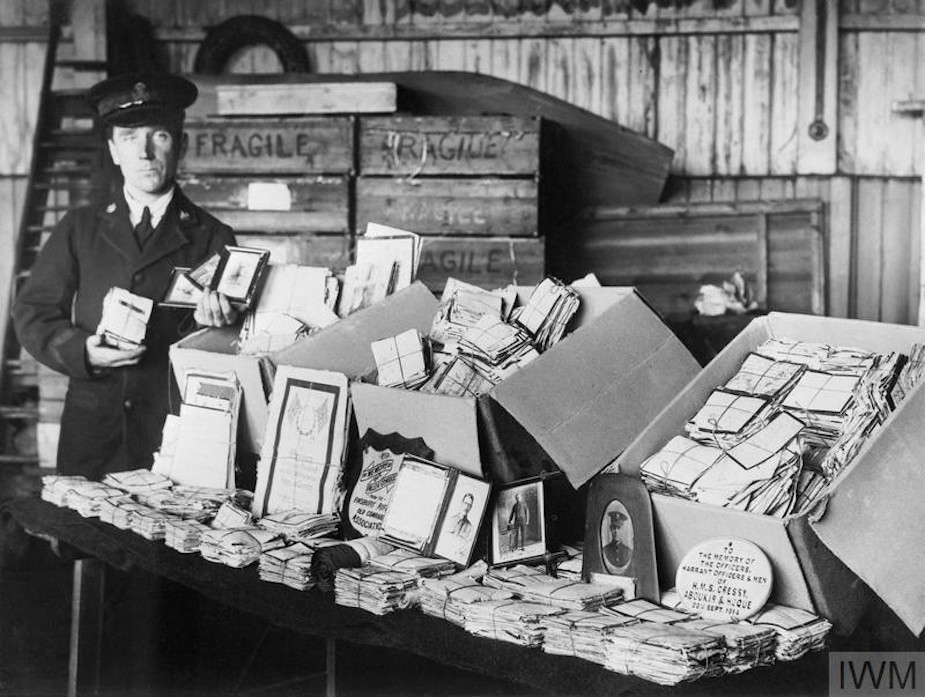
"By appealing to members of the public to send in photographs of themselves or their loved ones, the Imperial War Museum provided a crucial way for combatants to be recognised, giving comfort and a sense of pride to the bereaved.
"From mid-1917 the Imperial War Museum published calls for contribution in newspapers ranging from the Manchester Guardian to the Times of India and also in the ration books issued by the Ministry of Food. The ration book read ‘The Imperial War Museum desires to receive for permanent preservation photographs and biographical material, printed or in manuscript, of all officers and men who had lost their lives or won distinctions during the War.’"
From 'A Closer Look at the Bond of Sacrifice Collection' and 'Collection: Bond of Sacrifice — First World War portraits collection', Imperial War Museum website.
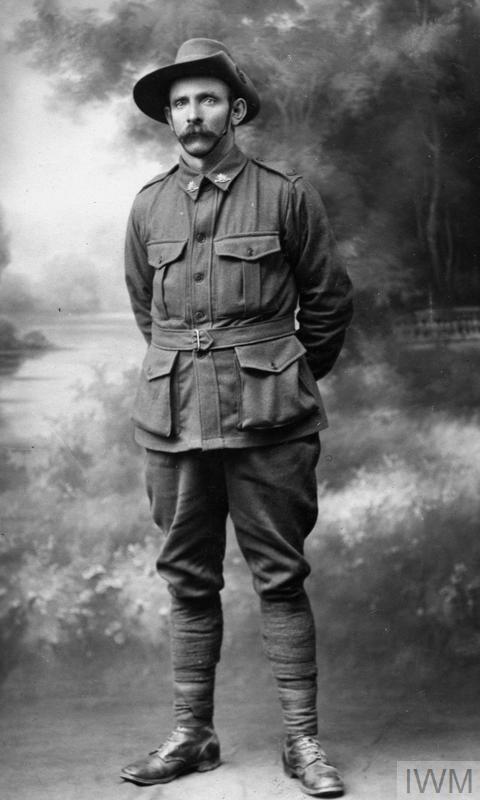
Mounted portraits of British, Australian and Canadian casualties (all ranks) of the First World War.
Data processing
The information needed to make this visualisation was present in the collection data, but not in the structure needed. Each soldier's record has a free-text description, but the records don't have a separate field for death date (and not all have a death date—it is sometimes unknown and the collection is not solely for soldiers who lost their lives).
These are some example records:
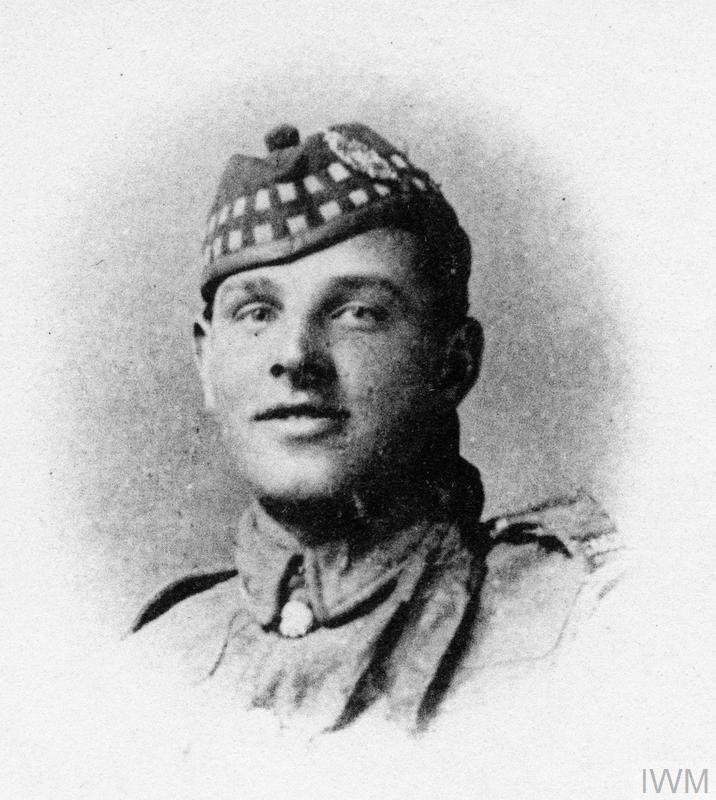
Private Walter Reed 18383. Unit: 2nd Battalion, King’s Own Scottish Borderers. Death: 23 July 1916, missing, Somme, Western Front. Commemorated on the Thiepval Memorial.
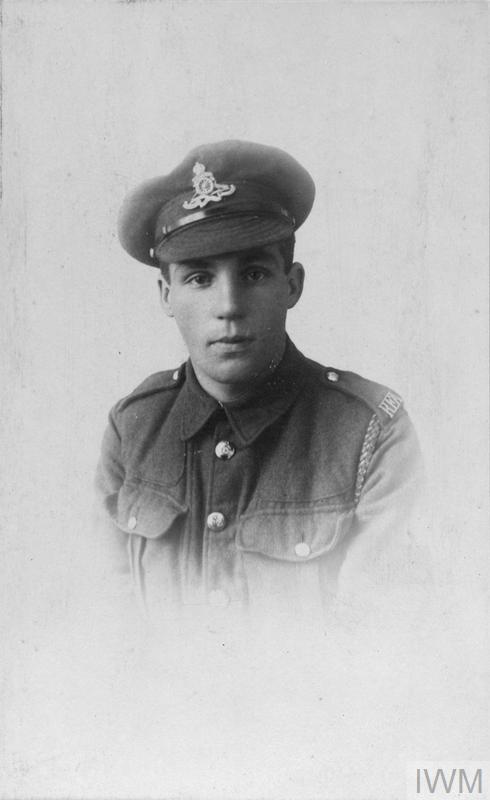
Private S E Bellew. Unit: Royal Field Artillery. Death: Not known
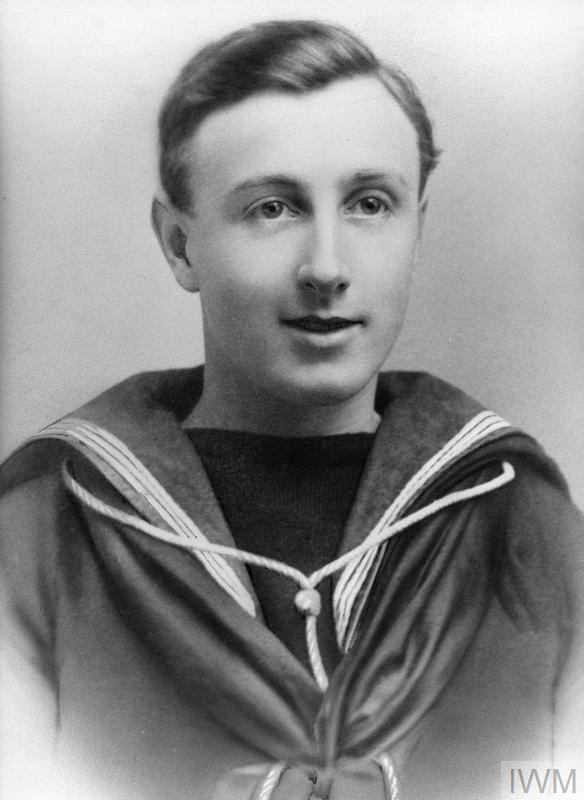
Able Seaman (Signalman) William George Waterman Tyneside Z/4464. Unit: Royal Naval Volunteer Reserve, HMS Hampshire. Death: 05 June 1916 Killed in Action when the cruiser H.M.S. “Hampshire” was sunk by a mine off the coast of Orkney. She was carrying Lord Kitchener who was lost along with over 600 other personnel. Only twelve men survived. Home Waters
Private W J Neighbaur, 'C' Company, 38th Battalion, 10th Brigade, Australian Imperial Force. He enlisted in April 1916. He was killed in action in May 1917.
There wasn't a downloadable dataset, so I scraped the IWM website. I then used a Python script with the following logic, based on the records' general structure and content, to extract a death date from the free-text descriptions:
Does the record say "Death: not known"?
---> YES : Ignore
---> NO : Does it have the words "died", "death", "killed", "missing" or "last seen alive" in the record?
---> NO : Ignore
---> YES : Are there any dates in the record?
---> NO : Ignore
---> YES : Is the latest date within the bounds of the WWI dates?
---> NO : Ignore
---> YES : Assume that is the death date.
This leaves about 7,000 records. From cross-checking the results against the original records, this algorithm does a good job extracting the correct date, though likely it will miss some.
Visualisation
The visualisation, very simply, selects a record at random every 0.1 second to cascade down at its date on the timeline, running continually. Since the sampling is random you get a sense, from the density of falling images, of when the most deadly periods were. You might notice fewer images falling directly beneath the '1916' marker; major offensives weren't conducted during winter.
This visualisation builds on a design created during the Science Museum hackathon, February 2017.